
Statistics for Clinicians

Module Overview
Summary
The basic Statistics course prepares learners to apply core statistical concepts in the context of clinical research. Participants will learn to apply key statistical principles, distinguish between common study designs and justify their selection based on specific research objectives, and construct research questions that are aligned to statistical principles. They will develop the ability to outline and critically review the key components of the statistic aspects of a study protocol and a statistical analysis plan. In addition, learners will assess when advanced trial designs—such as adaptive trials—are warranted and appraise their implications for study implementation and interpretation.
Target audience
This course is designed for clinicians who need to interpret and apply statistical concepts in clinical research and evidence-based practice.
Relevance to Clinical Practice/Research
A solid understanding of statistical principles is essential for clinicians and researchers to interpret study results with rigour and confidence, enabling informed, evidence-based decisions. This module bridges theory and practice by connecting statistical reasoning to real-world clinical questions—such as evaluating treatment effects, assessing study validity, and interpreting summary measures like risk ratios or odds ratios. By mastering these skills, learners will be equipped to critically appraise published research, contribute meaningfully to study design and data analysis discussions, and ensure that clinical and research decisions are grounded in robust statistical evidence.

Introduction
Statistics is fundamental to clinical research. No clinical study can be implemented without minimal requirements on statistical approaches. Otherwise, they are flawed and misinterpreted. And yes, ChatGPT cannot replace the key understanding of statistical elements in clinical research and the multidisciplinary dialogues with clinicians, data managers, monitors, study managers and other stakeholders to align statistical concepts for clinical research. Numbers alone do not speak for themselves; they need a correct interpretation and communication with all their advantages and limitations.
This module has the overarching learning outcome that you can implement research questions and hypotheses which can be statistically evaluated, communicated and interpreted by adequate study designs. We divided the module into four topics:
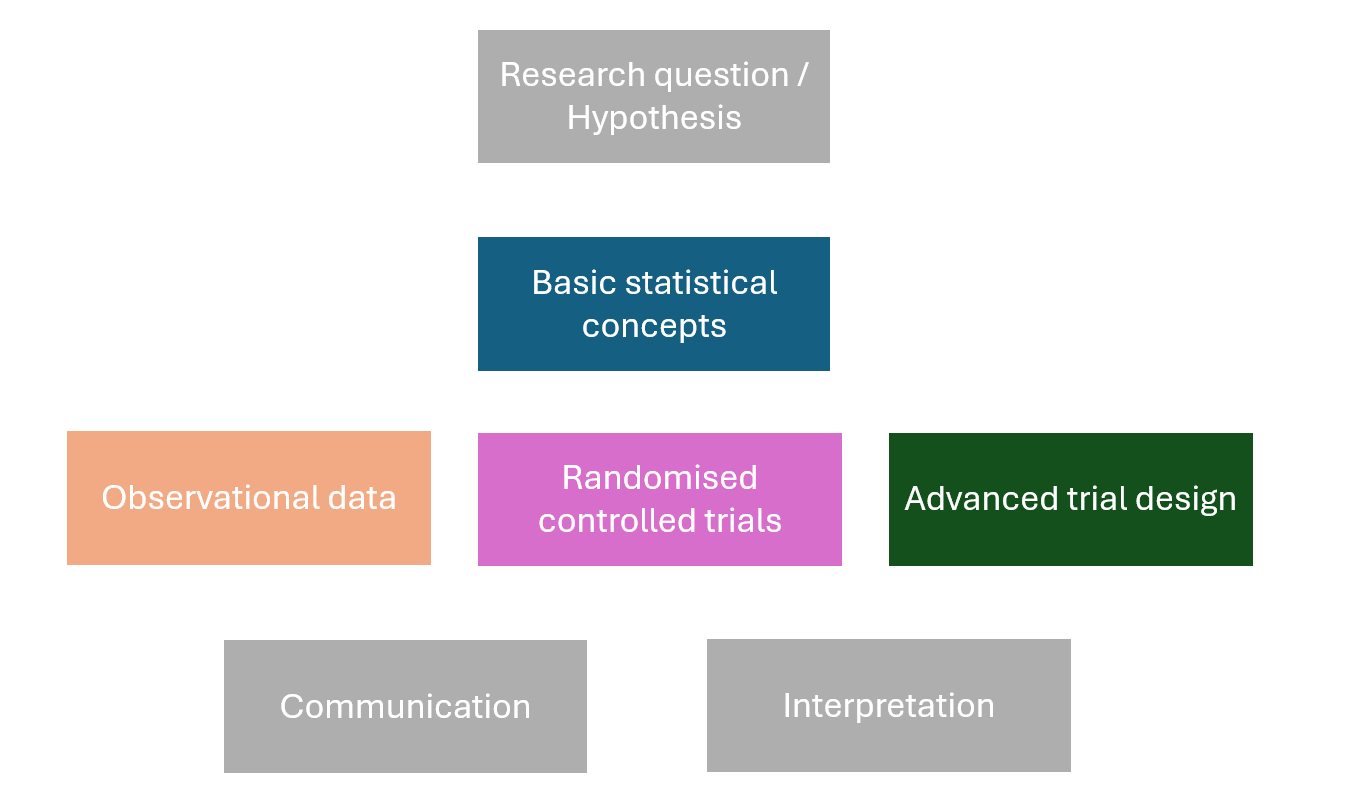
We start with the basic statistical concepts where we will introduce design and statistical tools. Design tools are key for planning clinical studies and you are likely already familiar with – or at least heard – of some tools. For example, the PICO framework which helps in precisely defining the population, intervention, control and outcome. From a statistical perspective PICO is not enough, because it allows of different interpretations of study results. This led to the introduction of the estimand framework in the ICH E9 guidelines back in the year 2020. Yet, before we can start using such frameworks, we have go one step back and introduce the statistical objectives in clinical research: Description, modelling and causal inference. Without knowing the key statistical objectives in clinical research it is not possible to follow the arguments of trial statisticians.
Clinical research is about creating evidence to guide patient care and support clinical decision-making. But single observations by themselves can be misleading. Patients are different, diseases progress in different ways and random variation is always present. Statistics gives us the tools to separate the "signal" from random noise. Without statistics, we risk drawing the wrong conclusions from limited or biased observations. Such tools, like hypothesis testing, p-values and others, we introduce in the subtopic of statistical tools. They are key principles for a correct interpretation and communication of study results.